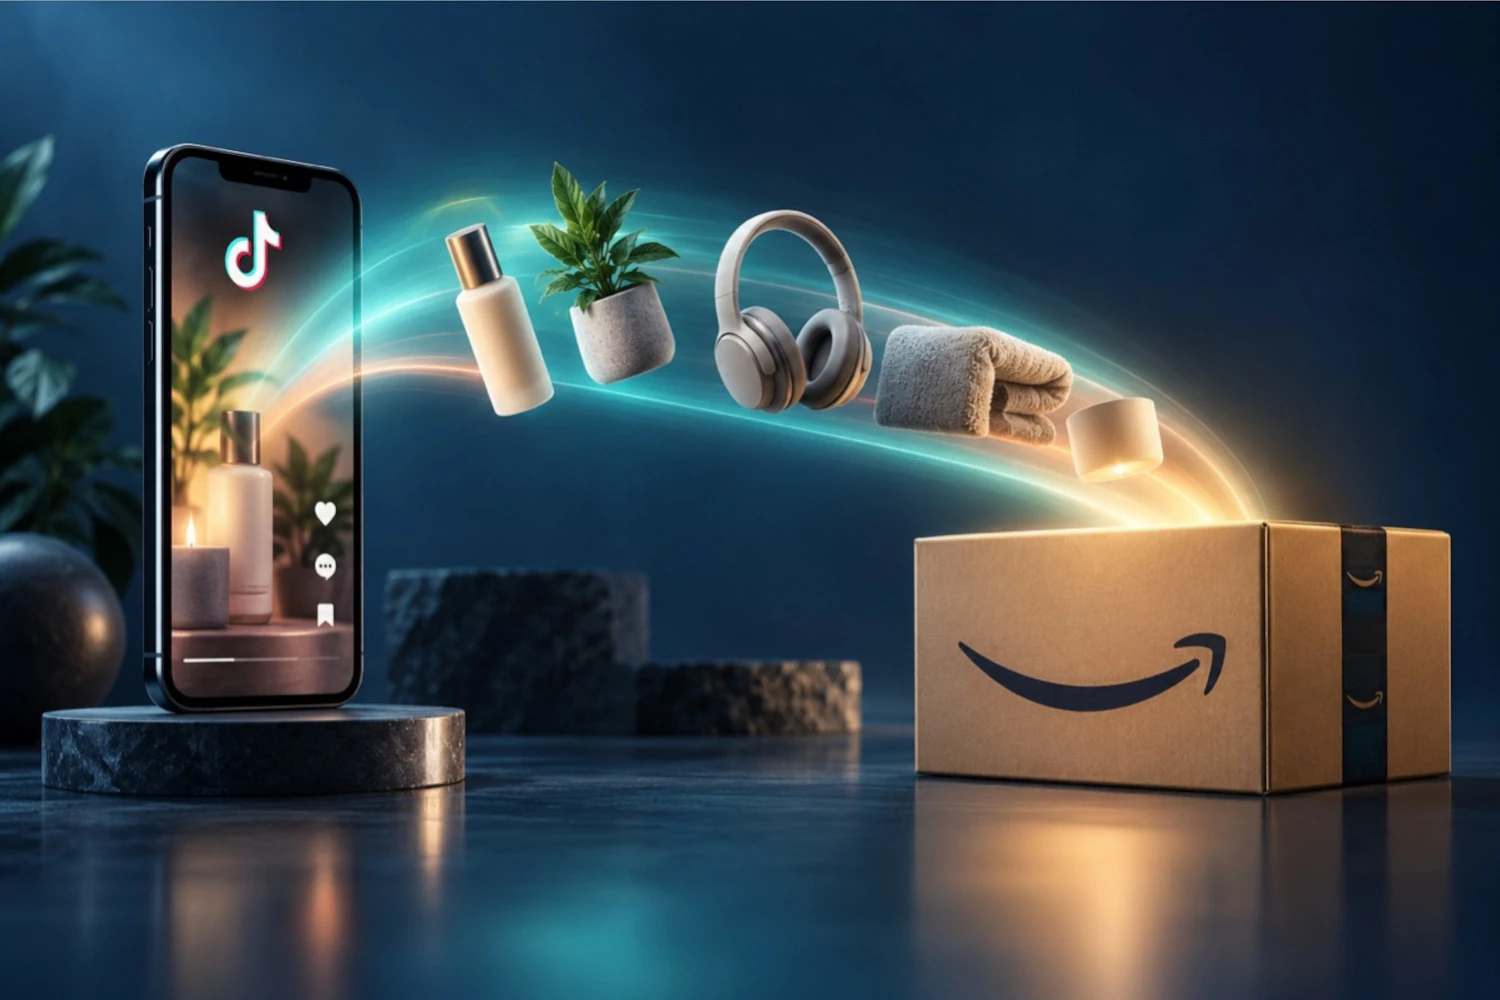
TikTok Shop’s ability to generate sales beyond its own checkout is well established. A shopper can discover a product through a shoppable video and complete the purchase on a brand’s website or on Amazon.
In 2026, Seller Center’s pixel-based off-site reporting has made the direct-to-consumer halo more measurable for brands with connected websites. In our experience at Trendio, many brands see attributed DTC sales of $0.35 or more for every dollar of TikTok Shop GMV.
For many brands, Amazon represents an even larger opportunity. Yet Amazon purchases are outside the scope of Seller Center’s pixel-based reporting. This research, developed through a partnership with Jungle Scout, examines that part of the halo.
We analyzed weekly TikTok Shop sales alongside Amazon sales estimates for matching products and product families. Across the eligible dataset, each additional dollar of TikTok Shop GMV was associated with approximately $0.61 in additional Amazon revenue one week later.
If that relationship reflects demand generated by TikTok, the implication is substantial: a dollar of incremental TikTok Shop GMV could represent $1.61 in combined revenue across the two channels.
The contribution of this research is a starting estimate for the Amazon halo: approximately 61 cents per additional TikTok Shop dollar, with substantial variation across brands and products.
Measuring the Amazon Halo
The analysis covered thousands of matched observations across 45 product families. We compared weekly sales changes for the same items across channels. Where TikTok sold bundles, we matched the relevant product family and removed overlapping groups to avoid double counting.
The pooled model accounted for differences between families and movements shared across the same calendar week. This brings the analysis closer to the commercial question: when demand for a particular product rises on TikTok Shop, does Amazon demand for that product follow?
What a One Week Halo Can Look Like
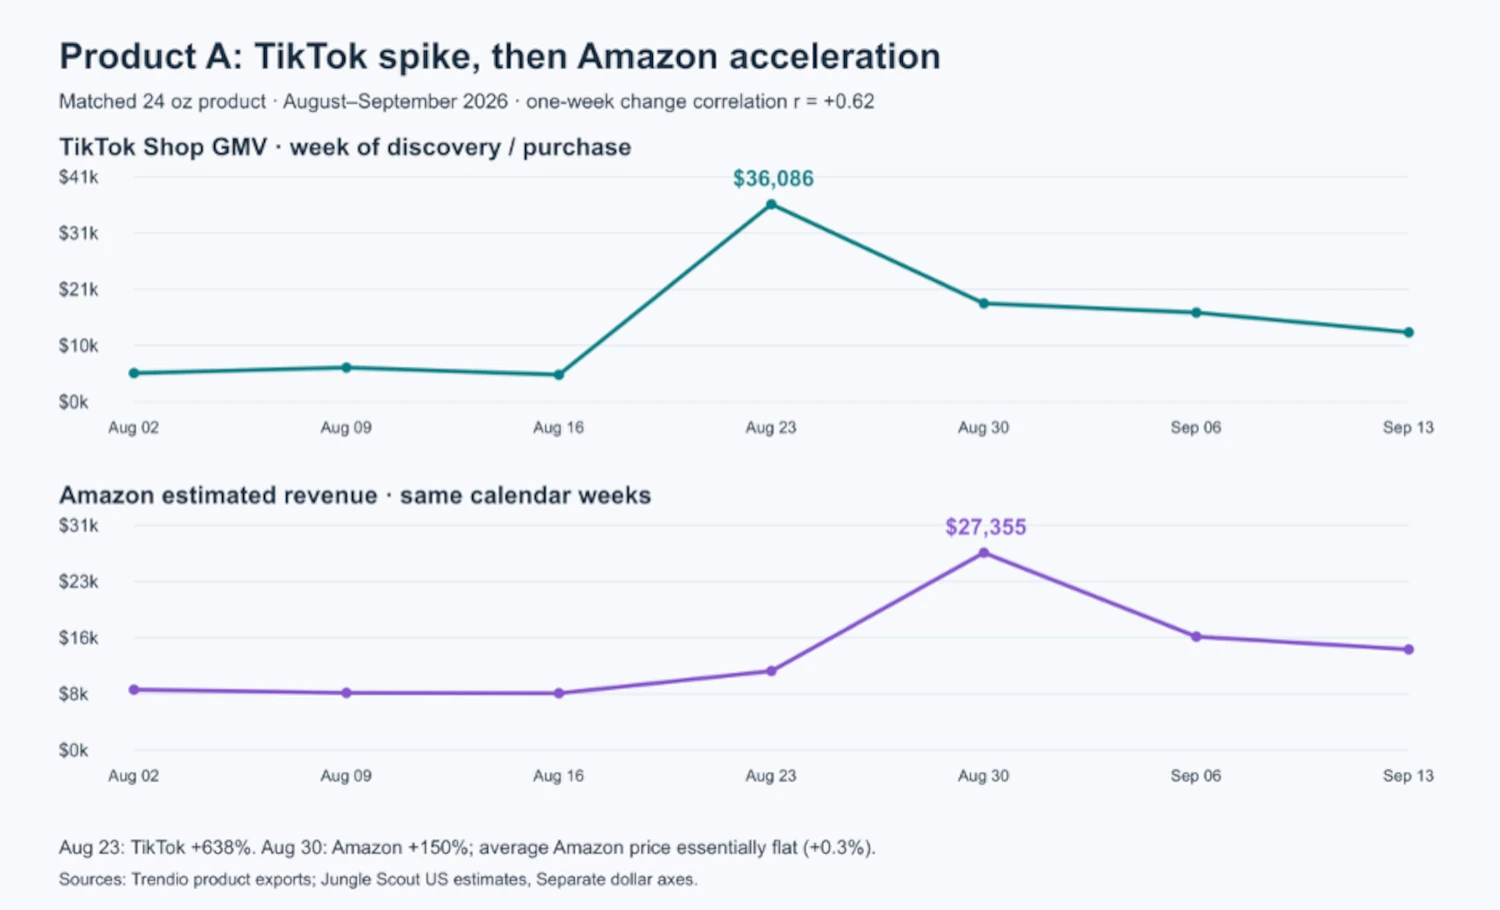
Here is an example from one of our clients. TikTok Shop GMV for a product rose from approximately $4,900 in the week of August 16 to $36,100 in the week of August 23. Amazon revenue then rose from approximately $11,000 in the week of August 23 to $27,400 in the week of August 30.
Another product from the same client showed a similar pattern earlier in the year. TikTok Shop GMV increased from approximately $6,800 to $14,100 in the week of May 24. Amazon revenue increased from approximately $3,900 to $5,400 the following week. Amazon unit sales also rose, by approximately 49%.
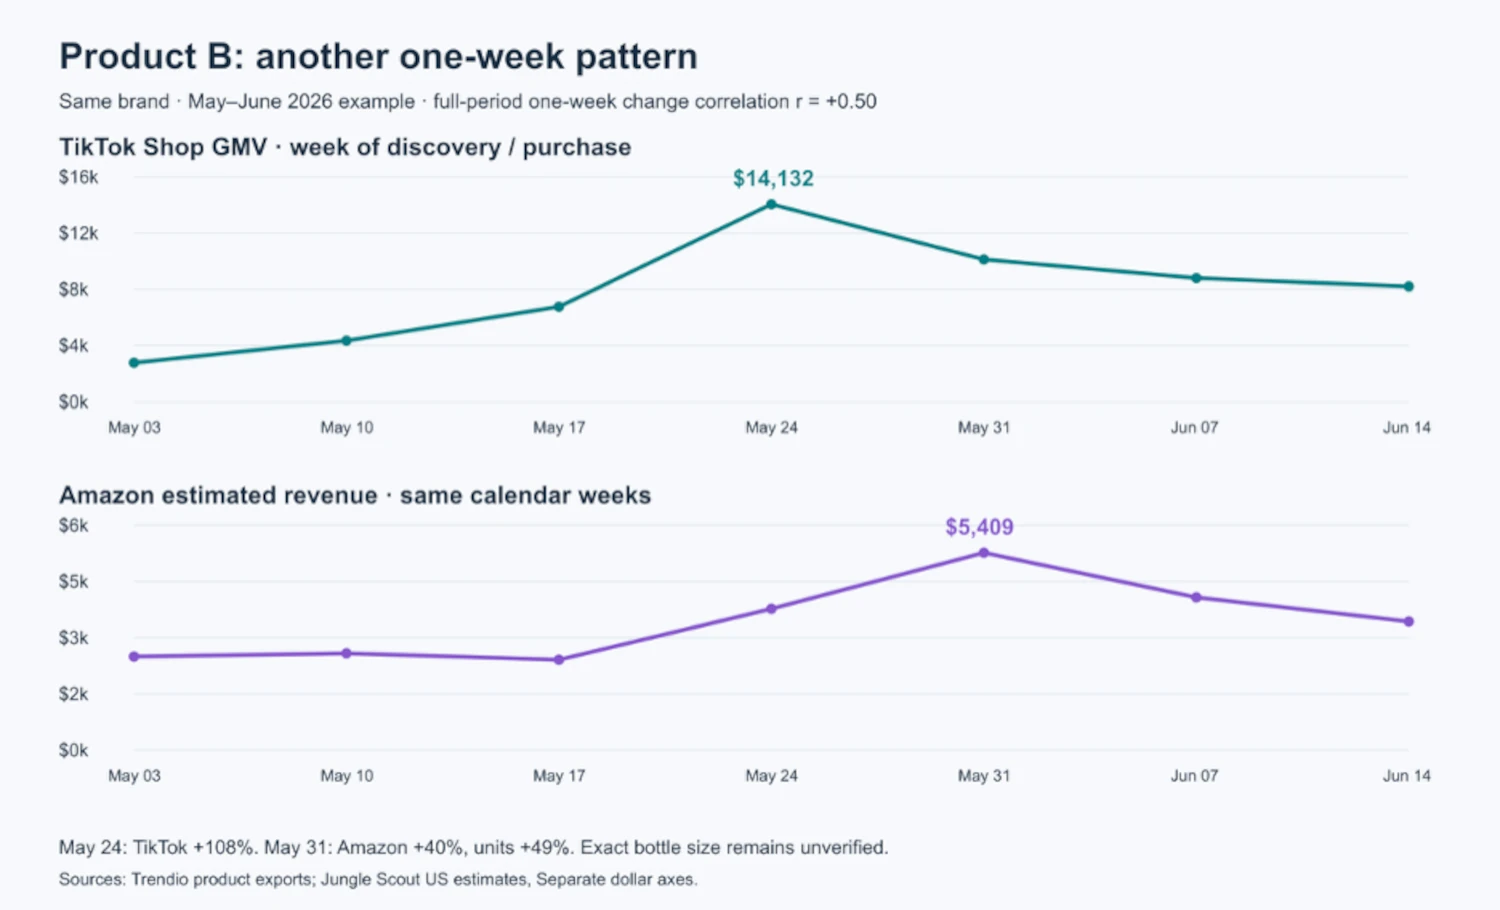
The timing is consistent with a plausible customer journey: discover a product in a TikTok video, consider it, and buy it later on Amazon. The data do not track individual shoppers, but these episodes show where that journey may become visible in product sales.
A Pooled Amazon Halo Estimate of 61 Cents
The pooled estimate stayed close to $0.61 when we tightened the analysis. Requiring longer product histories produced $0.60. Adding controls for changes in Amazon revenue per unit produced $0.62. Removing any single brand left a positive point estimate, ranging from $0.52 to $0.64.
Those checks are encouraging. The corrected seller analysis also produced positive adjusted estimates for the featured brand and two other sellers, although the latter results were less stable. We are seeing evidence worth pursuing beyond a single chart, without assuming every brand experiences the same effect.
Shared promotions, advertising, launches and stock availability could influence both channels. Amazon sales are estimates, and this was an exploratory analysis. The $0.61 result should therefore be treated as a promising estimate of a possible one-week halo, rather than a proven multiplier for every seller or a measure of cumulative impact.
A Starting Benchmark for the Amazon Halo
The value of this analysis is that it gives brands a number to start from. The pooled estimate of $0.61 in next-week Amazon revenue per additional TikTok Shop dollar provides an initial benchmark against which to assess their own results, recognizing that individual brands and products can vary substantially around it.
This is a pooled relationship, not an equal-weight average across brands or a forecast for every seller. Its commercial significance is the scale of the opportunity: if attributable to TikTok, the observed relationship would add 61% to the revenue associated with incremental TikTok Shop GMV, before considering any DTC halo.
We can now put an initial dollar estimate against an important part of TikTok Shop’s broader impact. That creates a more useful starting point for valuing the channel and understanding how much of the demand it generates may convert elsewhere.
Research Notes
This research was developed by Trendio through a partnership with Jungle Scout, combining Trendio weekly TikTok Shop product data with Jungle Scout Amazon US estimates. Client and product names have been anonymized. The pooled sample spans 36 exposure weeks from January 11 to September 13, 2026, with Amazon outcomes one week later. The model relates weekly dollar changes using product-family and calendar-week fixed effects. Its 95% four-week-block resampling interval is approximately $0.04–$0.74, conditional on the observed brands. Missing observations were not treated as zero. The one-week result followed exploration of multiple products and lags and has not been validated on held-out data.
The DTC figure reflects Trendio’s experience with client reporting and is separate from the Amazon dataset. Pixel attribution is not the same as experimentally measured incrementality; the DTC and Amazon figures should not be added as a validated combined multiplier.
DTC reporting reference: TikTok Shop Academy — Off-site Performance Analysis (September 2, 2026).
About Trendio
Trendio is a video shopping technology provider and agency that works with brands across categories on TikTok Shop, YouTube Shopping and video web embedding. Trendio combines proprietary AI solutions with channel expertise to identify and engage the best affiliate creators for every brand in every channel, manage their entire video creation process, optimize brands' own video posts using video AI, manage paid ads for maximum returns and deliver best-in-class tracking. For more information, visit www.trendio.ai.
About the Author(s)
Alex Perez-Tenessa is the Founder & CEO of Trendio. Prior to Trendio, he was the VP of US Prime Video at Amazon, VP of Beauty and Personal Care at CVS Health and Partner in the Retail Practice of McKinsey & Company.