
TikTok Shop is becoming a shopping destination across a much wider range of categories. Clothing, sports, furniture, and appliances are gaining weight. Established consumer brands are generating meaningful sales, while shoppers are buying products at prices well above the channel’s most familiar impulse purchases.
The shift creates an opportunity for brands that may not previously have considered TikTok Shop relevant to their business. The evidence extends from Crocs and Pacsun to Shark, Ninja, and EcoFlow, with premium apparel, jewelry, and connected devices adding new reasons to shop.
We examined US category estimates over the latest 180 days, compared January and September 2026 rankings, and looked at how persistent leading sellers are changing their creator networks. Together, the findings show a broader retail marketplace in which affordable offers and higher-value purchases coexist. [1]
The Mix of Shopping Is Broadening
The clearest evidence is the changing mix of GMV. Women’s clothing increases its share from 12.2% in the earlier period to 14.0% in the latest 180 days. Sports & Outdoor rises from 6.7% to 8.0%, men’s clothing from 3.4% to 4.1%, and furniture from 3.2% to 3.8%. Appliances also gain weight. Beauty and health’s combined share moves from 25.1% to 23.1%.
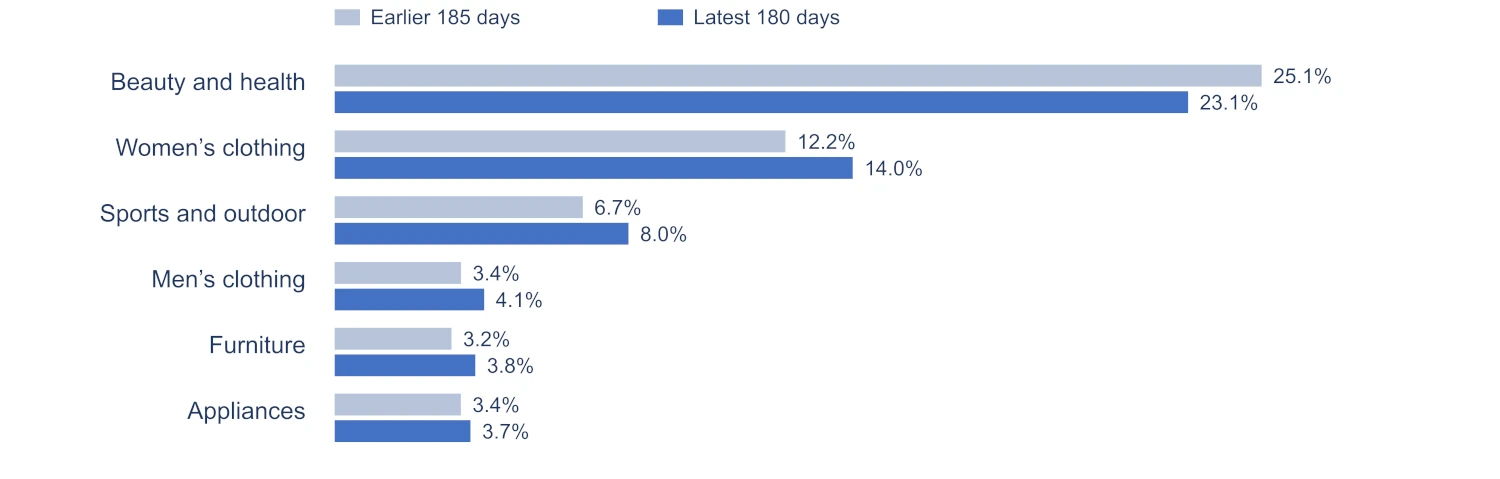
The latest 180-day estimates put women’s clothing at $1.58 billion, sports at $894 million, furniture at $428 million, and household appliances at $413 million. These are substantial markets for brands whose previous view of TikTok Shop may have been shaped by a narrower set of products.
Broadening does not mean that every category gains share simultaneously. Electronics and computers already generate meaningful sales without gaining weight in this comparison. The change is that shoppers have more reasons to regard TikTok Shop as a destination for different purchase occasions. [2]
Established Brands Are Building Meaningful Businesses
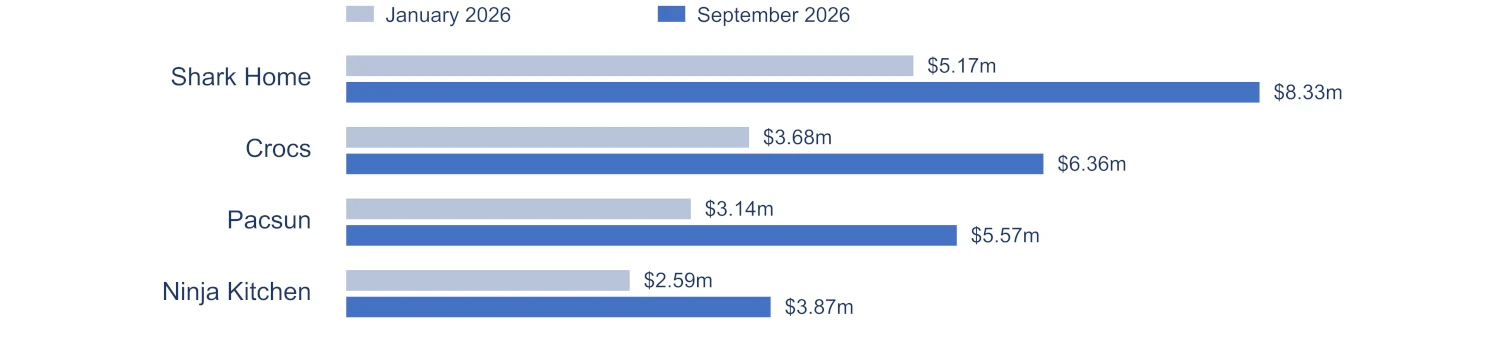
Established brands are growing across categories. Crocs’ estimated monthly GMV increases from $3.68 million in January to $6.36 million in September, while Pacsun rises from $3.14 million to $5.57 million. Shark Home moves from $5.17 million to $8.33 million and Ninja Kitchen from $2.59 million to $3.87 million. These are examples of brands building commercial scale as the channel develops. [3]
Sephora is another example of that broader development. A query covering September 19 through October 13 reports $3.17 million in estimated GMV following the retailer’s September launch. MAC also moves from #67 to #8 in the January-to-September beauty-shop ranking. The significant point is the commercial traction these names are finding. [4]
In apparel, Ralph Lauren’s official US shop lists polos, sweaters, footwear, and bags, including a $115 polo and a $608 leather tote. Its storefront shows purchases of those products. Samsung’s US TikTok Shop offers Galaxy devices spanning phones, tablets, earbuds, and wearables. These examples extend the channel’s assortment into familiar premium apparel and branded technology. [5]
Branded technology is generating sales too. In September’s electronics-shop ranking, Skullcandy records $1.31 million in category GMV, SHOKZ $990,000, Anker $665,000, and Samsung $602,000. An OMEN MAX gaming-laptop listing records approximately $50,000 in September GMV at an average selling price of $2,502. Best Buy’s forthcoming late-October launch would extend this assortment further, with nearly 10,000 products including laptops, cameras, headphones, and small appliances. [6]
Jewelry also spans different price points. PAVOI generates $2.43 million in September category GMV at an average selling price of $18.62, while Ettika generates $394,000 at $49. A listing described as a 14K gold Monaco chain generates approximately $61,000 at an average selling price of $1,419. TikTok separately reports that sales of single certified lab diamonds more than quadrupled from May to September. Affordable fashion jewelry and higher-value purchases are finding buyers within the same category. [7]
Higher Value Purchases and Price Competition Are Coexisting
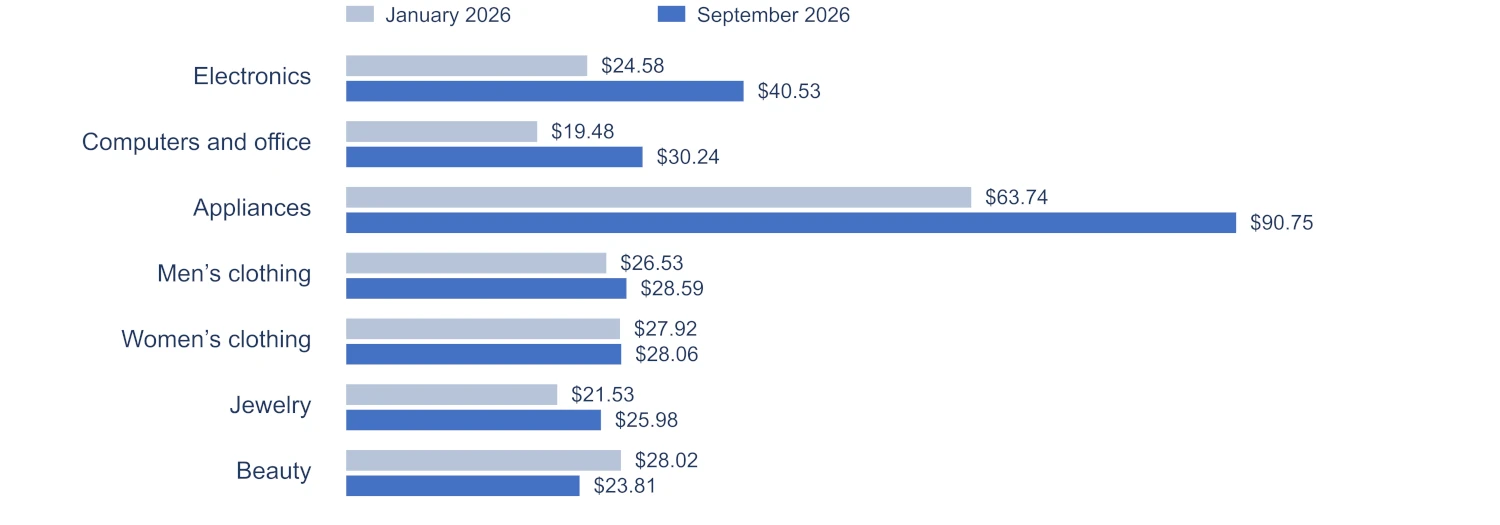
Across all 29 primary categories, GMV divided by units sold increases from $23.04 in the earlier period to $23.90 in the latest 180 days, or 3.7%. A January-to-September comparison of each category’s top 100 products reveals much sharper differences. Electronics’ unit-weighted average selling price rises from $24.58 to $40.53, appliances from $63.74 to $90.75, and computers and office equipment from $19.48 to $30.24. Men’s clothing rises more modestly, while women’s clothing is approximately flat. Beauty falls from $28.02 to $23.81. [8]
Affordable products remain central. Across April through September’s monthly top-100 product lists, products below $40 account for 58.3% of sample GMV. The overall market’s rising average therefore coexists with substantial demand at accessible prices. [9]
There are also clear examples of buyers accepting higher prices. Comfrt’s Dreamer Blanket rises from a $79.00 average selling price in January to $93.36 in September, while monthly GMV increases from $774,000 to $2.56 million. September’s leaders include an EcoFlow power-station-and-solar-panel offer at approximately $399, generating $1.59 million, and a Shark cordless vacuum at approximately $285, generating $1.20 million. [10]
Price competition is also visible within individual assortments. Five of six Dr.Melaxin listings appearing in both beauty top-100 lists have lower average prices in September. Medicube’s shop-level average falls from $40.67 to $28.72, yet its three listings present in both top-100 lists each have slightly higher average prices. These results distinguish price pressure on some offers from a shift in the mix of products sold. They do not establish that either brand discounted to defend volume. [11]
The jewelry sample illustrates the same unevenness. Its unit-weighted bestseller average rises from $21.53 to $25.98, while the median listing price falls from $23.11 to $21.32. Higher-value purchases can lift an average even when the typical leading offer becomes cheaper. Premium entry and price competition can develop together; the data do not establish that newer brands discount less. [12]
Bundles Are an Important Format Across Categories
Bundles give sellers a way to package a use case, a routine, or a more complete solution. September’s overall top-100 list includes a SNOWCLAD cookware set at an average selling price of $145, a Bourvill tool set at $134, a Monbix seven-piece bedding set at $58, and EcoFlow’s power-station-and-solar-panel offer at $399. The format is relevant well beyond skincare. [13]
The evidence does not show a broad increase in bundle penetration among the biggest offers. A manual classification of the overall top-100 product lists identifies 19 explicit multi-item offers in January and 18 in September, with their share of sample GMV moving from 24.2% to 20.4%. This selected sample measures leading offers, rather than the prevalence of bundles across every brand’s catalog. [14]
What the examples establish is that bundles can support very different price points and shopping needs. A cookware collection, a bedding set, and an energy system each give creators a concrete package to demonstrate and explain. Whether the offer creates incremental demand or improves margin requires brand-level economics that these rankings do not provide.
Creator Distribution Is Expanding Across Categories
Leading sellers are building larger creator networks in several categories. Among women’s clothing shops appearing in both January’s and September’s top 20, ten of eleven increase their participating creator count. The median increase within those shops is 83.2%. Among 31 shops appearing in both beauty top-50 lists, 27 increase, with a median gain of 63.6%. In health’s matched top-20 group, eight of thirteen increase, with a median gain of 18.9%. [15]
The dependence on affiliate distribution also extends across categories. In the latest 30-day shop ranking, affiliate-attributed GMV represents approximately 94% of Pacsun’s sales, 89% of Crocs’, 90% of Ninja Kitchen’s, and 94% of Shark Home’s. EcoFlow is less dependent at approximately 42%, with much of its reported revenue attributed to the shopping-mall channel. [16]
These differences matter. Larger creator networks are becoming part of the operating model for many leading sellers, but the importance of affiliate distribution varies by business. The counts measure participating creators, rather than verified contracted affiliates, and the selected matched groups do not represent every seller on the platform.
LIVE Is Growing but Its Role Differs by Category
TikTok reports that US LIVE Shopping sales more than doubled in the first half of 2026 compared with the first half of 2025. That provides evidence of strong annual growth. Our Kalodata comparison answers a different question: across the latest 180 days versus the preceding 185, estimated daily LIVE GMV is roughly flat to slightly higher, while LIVE’s share of total GMV declines from 19.0% to 17.5%. [17]
LIVE remains a minority of overall sales, but its relevance differs considerably across categories. In the latest 180-day estimates, it contributes 26.0% of jewelry GMV, 23.4% of appliances, 19.2% of furniture, 17.7% of phones and electronics, and 13.3% of women’s clothing. Appliances’ LIVE share rises from 18.9% in the earlier period to 23.4%; health’s rises from 23.5% to 24.6%. [18]
Video is still the larger sales channel in these categories, contributing approximately 70% of women’s clothing GMV, 64% of appliances and electronics, and 52% of furniture. TikTok Shop’s broadening is happening through several selling formats. Brands now encounter a wider set of shopping occasions, price points, and distribution models within the same channel. [19]
Sources and Research Notes
[1] Kalodata US Open API. Research scope: 29 primary categories, rolling 180/365-day totals, January/September 2026 rankings, and matched creator cohorts. Retrieved October 13–14, 2026.
[2] Kalodata category detail responses. Category shares and GMV: latest 180 days versus preceding 185, reconstructed from rolling totals.
[3] Kalodata whole-shop rankings. Crocs, Pacsun, Shark Home, and Ninja Kitchen monthly GMV, January versus September 2026.
[4] Kalodata Sephora shop detail, September 19–October 13, 2026; January/September beauty-shop rankings for MAC. Sephora confirms September 19 US launch. Source
[5] Ralph Lauren official US storefront and Samsung Electronics America. Storefront prices and purchase indicators are snapshots. Source 1 Source 2
[6] Kalodata September electronics-shop rankings and OMEN MAX product detail. Best Buy announcement specifies a late-October launch and nearly 10,000 products. Source
[7] Kalodata September jewelry-shop rankings and gold-chain product detail. TikTok reports certified lab-diamond sales growth from May to September. Source
[8] Kalodata category details and January/September top-100 product lists. All-market unit average and seven category bestseller averages; rotating product samples.
[9] Kalodata monthly overall top-100 product lists, April–September 2026. Under-$40 calculation uses 600 product-month observations.
[10] Kalodata January/September product rankings: Comfrt Dreamer Blanket; September EcoFlow battery-and-panel and Shark cordless vacuum listings.
[11] Kalodata January/September beauty top-100 product lists, matched by listing ID, plus Medicube shop average selling prices.
[12] Kalodata January/September jewelry top-100 product lists. Unit-weighted average and median of listing average prices.
[13] Kalodata September overall top-100 products: SNOWCLAD cookware, Bourvill tools, Monbix bedding, and EcoFlow battery-and-panel offers.
[14] Manual classification of Kalodata January/September overall top-100 products. Explicit multi-item offers: 19/18 listings and 24.2%/20.4% of sample GMV.
[15] Kalodata January/September creator counts for persistent top-20 women’s clothing, top-50 beauty, and top-20 health shops. Median within-shop percentage changes.
[16] Kalodata rolling 30-day shop rankings retrieved October 13, 2026. Affiliate-attributed shares for Pacsun, Crocs, Ninja Kitchen, Shark Home, and EcoFlow.
[17] TikTok US LIVE Shopping growth, first-half 2026 versus 2025. Kalodata category details provide the separate sequential rolling-window comparison. Source
[18] Kalodata category details. LIVE share of category GMV over the latest 180 days and, where stated, the reconstructed preceding 185 days.
[19] Kalodata category details. Video-attributed GMV shares for women’s clothing, appliances, electronics, and furniture in the latest 180 days.
Kalodata US Open API, retrieved October 13–14, 2026; USD. All-market comparisons use the latest rolling 180 days versus the preceding 185, reconstructed as rolling 365-day totals minus rolling 180-day totals. This assumes additive, consistent category coverage. The provider supplies no explicit rolling-window dates. Results are estimates, not audited figures; comparisons are not seasonally adjusted or year-over-year.
Product and creator comparisons use January and September 2026 (31 and 30 days). Prices are GMV divided by units or reported unit prices. Category prices cover each month’s top 100 products by GMV: rotating samples, not fixed baskets or market-wide inflation. Computers/office includes stationery and accessories. Matched listing IDs can contain changing variants, so they do not establish discount depth. Bundles include explicit sets, kits, multipacks, advent calendars, and EcoFlow’s battery-and-panel offer; integrated multifunction devices and shipping packages are excluded. The under-$40 result covers 600 product-months from April–September.
Creator cohorts hold shop identity fixed: 11 persistent top-20 women’s clothing shops, 31 top-50 beauty shops, and 13 top-20 health shops. Medians use each shop’s percentage change; persistent-leader selection introduces survivorship bias. Creator counts do not isolate paid affiliates or deduplicate across shops. Affiliate and video/LIVE attribution are separate dimensions. Sephora’s $3.17 million covers September 19–October 13. Brand growth uses whole-shop rankings; electronics and jewelry figures use category-filtered rankings. Listing descriptions do not independently verify materials or seller authorization; public prices are snapshots. No causal profitability conclusion is drawn.
About Trendio
Trendio is a video shopping technology provider and agency that works with brands across categories on TikTok Shop, YouTube Shopping and video web embedding. Trendio combines proprietary AI solutions with channel expertise to identify and engage the best affiliate creators for every brand in every channel, manage their entire video creation process, optimize brands' own video posts using video AI, manage paid ads for maximum returns and deliver best-in-class tracking. For more information, visit www.trendio.ai.
About the Author(s)
Alex Perez-Tenessa is the Founder & CEO of Trendio. Prior to Trendio, he was the VP of US Prime Video at Amazon, VP of Beauty and Personal Care at CVS Health and Partner in the Retail Practice of McKinsey & Company.